Real-time reports provide
useful insights for businesses that help them understand how their
systems are reacting, instantly, such as when you send out an email
campaign or engage in marketing that has a temporal nature. It provides
alerting / intelligence, giving insight into things that are new or
different such as a sudden increase in site traffic. Real-time also lets
you win social by capitalizing on trending topics. For example, if you
noticed a blog post you published previously is suddenly gaining
attention due to something happening in the news, you could highlight it
on the front page of your site to draw additional attention and ‘pour
fuel’ on the social fire.
Today, we're announcing 4 improvements to real-time reports. You can now:
- Analyze Events in real-time
- Breakdown real-time by Desktop/Tablet/Mobile traffic
- Create shortcuts to your favorite real-time segments
- Compare real-time filtered data against overall real-time data
Let’s go through the changes in more detail:
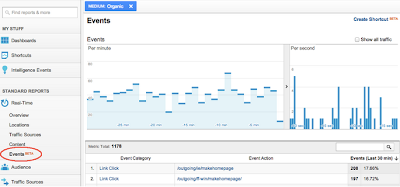
1. Realtime Events Report
With the real-time events report, you can now not only see the top
events as they occur but also filter on particular event categories (and
actions). Additionally, you can see whether particular segments of
visitors trigger different events and debug your events deployment in
real time.
To access this report, navigate to the real-time section of Google
Analytics and click on the Events section. You should see a report
similar to this:

Clicking on any of the Event Category will drill down and show all the
Event Actions and Event Labels for that particular category.
If you are trying to see what events a particular segment of visitors
generate, that is easy as well. Any filters you set up in any part of
real-time are preserved in the Events report. For example, in the above
screengrab we have set up a filter here to see what events are triggered
from visitors coming via organic search.
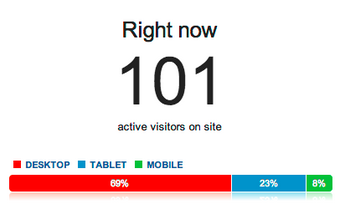
2. Content Breakdown by Desktop/Tablet/Mobile
We live in an increasingly multi-screen world, and now you can see in
real-time the type of device that visitors are using to visit your web
site (desktop, tablet and mobile). This is available in the content
report as shown below:
As with real-time reports, you can easily see your visitors filtered by
the device type (by clicking on either of “Desktop” “Tablet” “Mobile”).
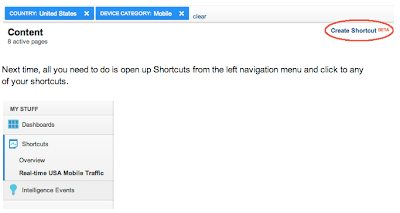
3. Shortcuts for your important real-time segments
We’ve heard from users that you like to look at certain segments of
visitors in real-time, but dislike setting up the filters each time.
Now, you can use the “Create Shortcut” feature to store your favorite
segments.
Now all you need to do is open up Shortcuts from the left navigation menu and click to any of your shortcuts.
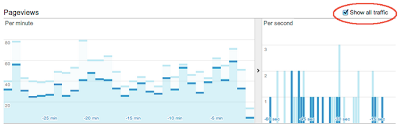
4. Comparison real-time to overall data
Finally, you can compare the pageviews of your segmented visitors to
overall traffic as shown below. This is nifty if you want to see quick
comparison trends. For example, many times, after a G+ post, I create a
filter by device type of “Mobile” and can see that the mobile traffic
picks up much faster and also contributes more to the initial increase
in pageviews.
Stay tuned for continued improvements to real-time, a growing area of importance for your digital marketing.
No comments:
Post a Comment